Social media success lies in doing more of what works, and less of what doesn’t. So, how do you know what’s hit or miss?
Take a look at your social media analytics. These numbers are more than just likes or retweets. They’re the quantitative facts to help direct your social media content.
Once again, let’s assume you’re using the Big 3: Facebook, Twitter, and Instagram.
1) Facebook Pages Insights

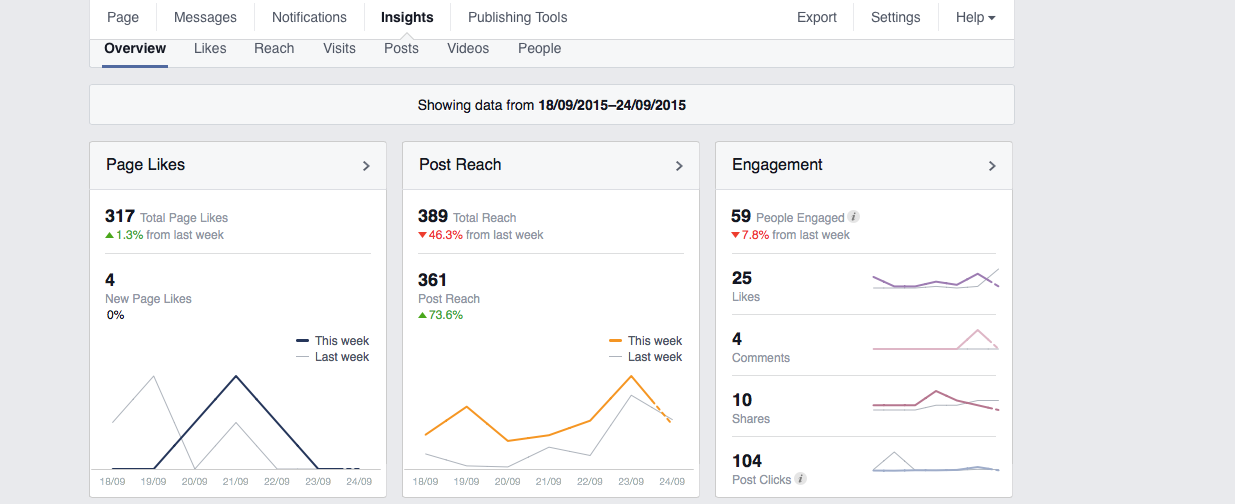
This nifty feature is the most useful for anyone promoting their nonprofit or small business via a Facebook Page. The overview will give you some quick facts: Page Likes, Post Reach, Engagement, and then some stats on your five most recent posts.
Explore beyond just the Overview section under the Insights tab. You’ll find a lot of helpful numbers.
Out of any sections under the Insights tab, the three most useful are Reach, Posts, and People. Reach gives you a graph about post shares, likes, and comments, along with your organic post performance. In the Posts section, you’ll find a useful graph that tells you when your consumers are most active online by day and time, and what posts have the most engagement. And when you click on People, this is all of your demographic information.
It’s a good idea to take a look at the Posts section on a regular basis, and take note of which posts people are engaging with. Since it lets you know how many clicks something gets, you can understand your audience’s behavior even if they don’t hit the like button. You’ll notice that a post with lots of clicks has a reach that is higher. Take note of the posts that get more clicks and have a higher reach, and think about why it got those numbers. It could be the type of content, the subject matter or even the time of day it was posted. Then think about how you can do more successful posts, and less of the posts that get nothing.
2) Twitter Analytics

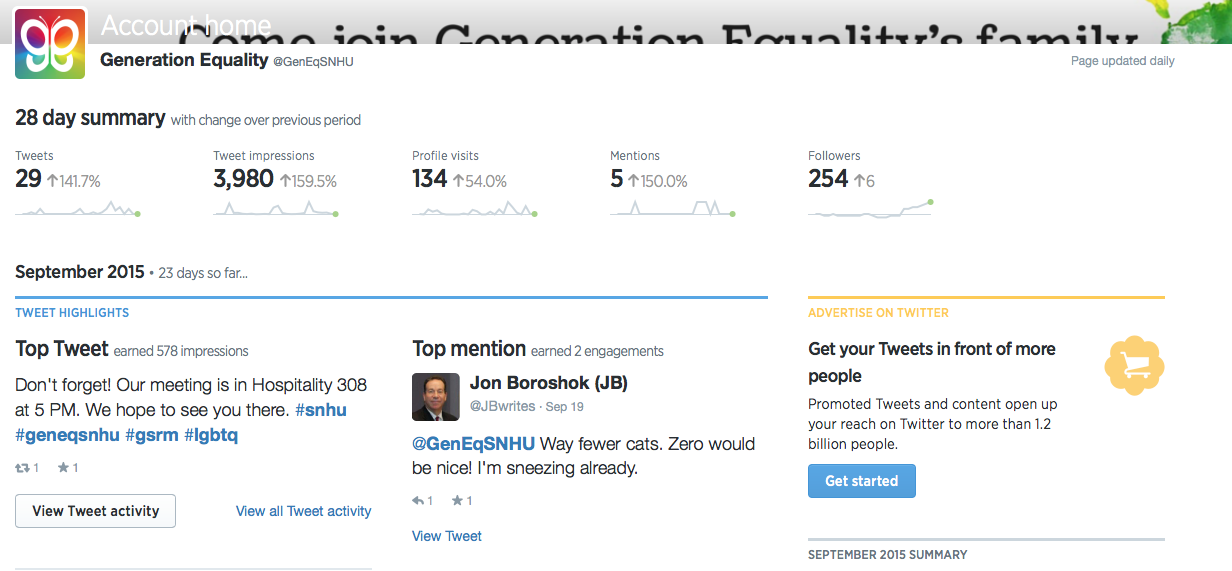
Ever want some numbers to go alongside your retweet notifications? Twitter Analytics has all of the information you could ever want. Updated daily, you can always check with how you’re doing at the top of the Analytics page by skimming the line graphs at the top.
With a month to month analysis, Twitter Analytics pulls up Tweet Highlights and a summary. You’ll be able to see your Top Tweet, Top Mention, and Top Media Tweet (which had a photo, video, or gif). The monthly summary will be your Tweet impressions, profile visits, mentions and new or lost followers.
3) Iconosquare
![]()
I mentioned this tool last time, but its so useful, I had to bring it up again. Iconosquare analyzes your Instagram account engagement. Look under the Engagement and Optimization sections to make the most of your stats.
Engagement is an overview of your most liked posts, where your likes come from, and the posts that receive the most comments.
In Optimization, you’ll find a graph on your posting habits, which filters have the best impact on your likes or comments, and a hashtag cloud.
We’ll talk about engaging hashtags in the future, so stay tuned!
Numbers are only as scary as you make them to be, even just starting out. Its okay to be nervous. Make some tea. We’ve got your back.

